Simple Linear Regression Model Implementation in Python
April 29, 2025
We will walk through how to implement a Simple Linear Regression model step-by-step using Python. You'll learn how to load data, train a model, make predictions, and visualize results using pandas, scikit-learn, and matplotlib.
To read the theory about Linear Regression Models, follow this link
Simple Linear Regression
Import the necessary libraries
import pandas as pd
import matplotlib.pyplot as plt
Read the data
For this example, we will be using a dataset available on Kaggle. . You can find it here: https://www.kaggle.com/datasets/karthickveerakumar/salary-data-simple-linear-regression?select=Salary_Data.csv
Salary_Data
| YearsExperience | Salary |
|---|---|
| 1.1 | 39343.00 |
| 1.3 | 46205.00 |
| 1.5 | 37731.00 |
| 2.0 | 43525.00 |
| 2.2 | 39891.00 |
data = pd.read_csv('Salary_Data.csv')

X = data.iloc[:, :-1].values # All columns except the last
y = data.iloc[:, -1].values # Only the last column
Splitting Data
We will now use scikit-learn to split the data into a training and test set.
from sklearn.model_selection import train_test_split

# Use 20% of data as test data. Set random_state to keep results reproducible
X_train, X_test, y_train, y_test = train_test_split(
    X, y, test_size=0.2, random_state=0
)
Model Selection
from sklearn.linear_model import LinearRegression

# Create an instance of the model
model = LinearRegression()

# Train the model with the training data
model.fit(X_train, y_train)
Make a Prediction
# Predict the test set results
y_pred = model.predict(X_test)
Visualize the Results
# Let's visualize the results for the Training Set first:
plt.scatter(X_train, y_train, color='red')
plt.plot(X_train, model.predict(X_train), color='blue')
plt.title('Salary vs Experience (Training set)')
plt.xlabel('Years of Experience')
plt.ylabel('Salary')
plt.show()
Simple Linear Regression Training Set
Visualize Predictions
To show the predictions for the test set, you follow the same steps.
plt.scatter(X_test, y_test, color='red')
plt.plot(X_train, model.predict(X_train), color='blue') # Line stays the same
plt.title('Salary vs Experience (Test set)')
plt.xlabel('Years of Experience')
plt.ylabel('Salary')
plt.show()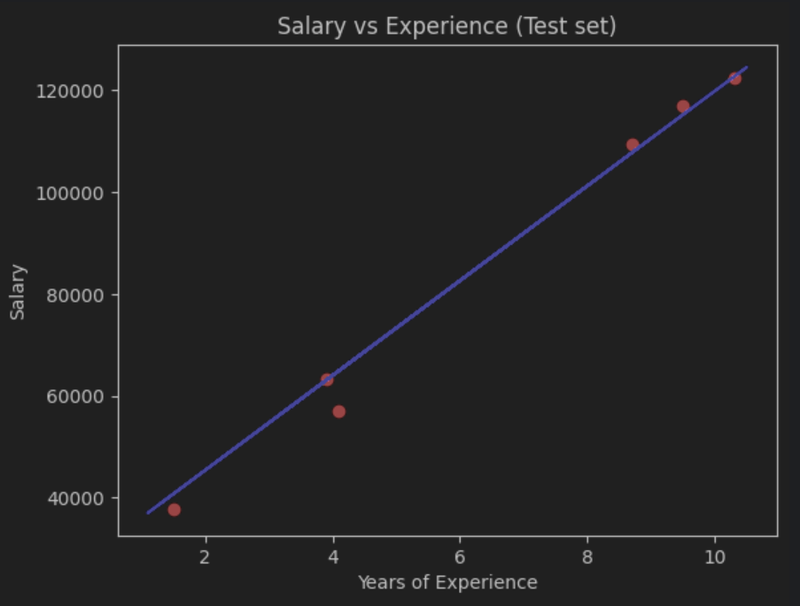
Simple Linear Regression Test Set
Test your knowledge
- What does the .fit() method do in linear regression?
It trains the model on the training data.
2. What percentage of the dataset is typically used for testing?
20%
3. When plotting the regression results, why do we reuse the model’s prediction on the training data even when plotting the test set?
Because the regression line is based only on the training data and stays fixed.
4. With pandas, select all columns except the last one
data.iloc[:, :-1].values
5. With pandas, select only the last column
data.iloc[:, -1].values